
 W4M : http://workflow4metabolomics.org/
 PeakForest : https://peakforest.org/
 NMRProcFlow: http://www.nmrprocflow.org/
 BiotStatFlow
Met4J
Met4J is an open-source Java library dedicated to the structural analysis of metabolic networks. It also came with a toolbox gathering CLI for several analyses relevant to metabolism-related research. This toolkit is also accessible via a graphical interface on Galaxy (https://met4j.usegalaxy.fr/).
 MetExplore
- A collection of curated genome-scale metabolic networks for multiple organisms, together with the possibility to import custom metabolic networks from SBML files.
- A metabolite identification module that maps experimental metabolites onto metabolic networks using ChEBI identifiers.
- Pathway overrepresentation analysis to identify significantly enriched metabolic pathways from mapped metabolite datasets.
- Context-specific subnetwork extraction, enabling users to generate biologically meaningful subnetworks from their experimental data.
- Interactive network visualization and editing, allowing users to explore, customize, and share reproducible graphical representations of metabolic networks.
- A programmatic API providing access to MetExplore 3 data structures and analytical methods from external programming environments, facilitating integration into automated bioinformatics workflows.
MS-CleanR: A package for cleaning and annotating LC-MS data
The MS-CleanR package provides functions for feature filtering and annotation of LC-MS data.
See the publication and tutorials (pdf files included in the master branch) for more information.
Needs MS-DIAL (v4.00 or higher) and MS-FINDER (3.30 or higher): http://prime.psc.riken.jp/compms/index.html
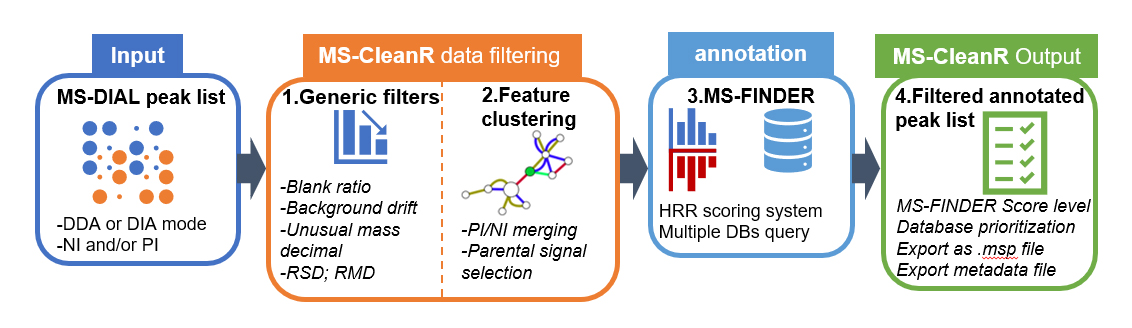
MS-CleanR use as input MS-DIAL peak list processed in data dependent analysis (DDA) or data independent analysis (DIA) using either positive ionization mode (PI) or negative ionization mode (NI) or both. First, MS-CleanR apply generic filters encompassing blank injection signal subtraction, background ions drift removal, unusual mass defect filtering, relative standard deviation threshold (RSD) based on sample class and relative mass defect (RMD) window filtering. All these options are tunable by the user. The second step involves a feature clustering method based on MS-DIAL peak character estimation algorithm followed by parental signal extraction using multi-level optimization of modularity algorithm. Optionally, MS-CleanR can merge PI and NI mode during this step. Then, all selected features are exported to MS-FINDER program for in silico-based annotation using hydrogen rearrangement rules (HRR) scoring system. At this step, multiple databases can be queried and each annotation results will be handled by MS-CleanR. The final step will merge annotation results to the filtered peak list by prioritizing database annotation depending on user choice. Optionally, all results can be exported as .msp file for mass spectral similarity networking purpose.
Installation : devtools::install_github("eMetaboHUB/MS-CleanR")
library(mscleanr)
runGUI()
Citation Publication link: https://www.biorxiv.org/content/10.1101/2020.04.09.033308v2
Credits : Université Toulouse ; MetaToul-AgromiX Platform
Licence : GPL-3